|
Volume Technical
Analysis.
The market as a whole has
to be analyzed to make a signal decision. It's very risky to
concentrate technical analysis only around NASDAQ 100. Sometimes
companies that belong to DJU, DJT or even the Russell 2000 can cause
whole U.S. Market, including the NASDAQ 100, to move up. The news on
the other indexes sometimes acts as a catalyst for the Nasdaq NASDAQ
100.
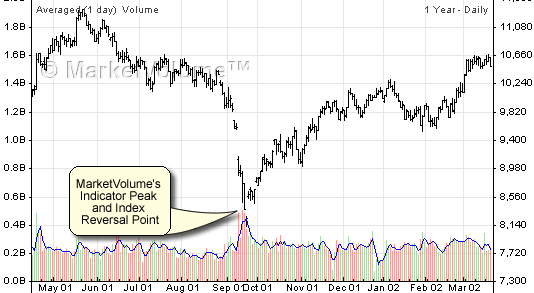
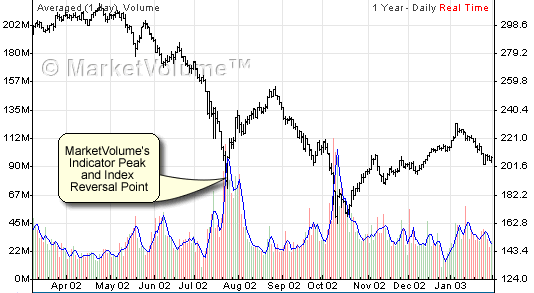
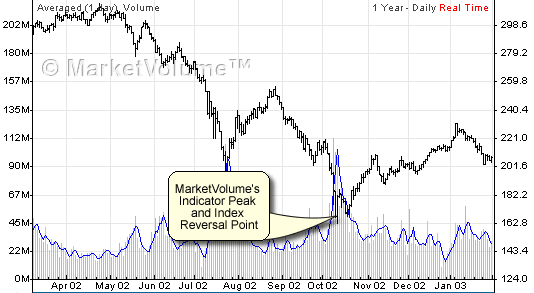
From the examples below you van see how
MarketVolume's Real-Time Volume Indicator shows index reversal points.
|
As a result we went into "long"
at 09/25/2001.
This trade gave our subscribers
13.5 % gain. |
 |
|
S&P 500 chart courtesy of
MarketVolume.com. |
|
As a result we went into "long" at
07/24/2002.
This trade gave our subscribers
16.6 % gain. |
 |
|
Russell 2000 chart courtesy of
MarketVolume.com. |
|
As a result we went into "long"
at 10/25/2002 and 11/27/2002.
These two trades
gave our subscribers
more than 16 % gain (+8.6
% and +7.4
%). |
 |
|
Russell 2000 chart courtesy of
MarketVolume.com. |
If you would like to learn
more about our signals system, you can do so at
MarketVolume. Volume
analysis is quite complex. There are many different factors that can
affect the market, all of which have to be considered when analyzing
volume.
Open an account Today!
|


