|
Volume
spikes and index reversal points
(charts examples)
When you look at the big volume spikes shown in
the following examples, ask yourself what could possibly have caused
all this extraordinary volume activity and how might this affect the
S&P 500 index. Quite simply, the market can react in one of two
ways: either continue along its current path or reverse course and
head the other way. Index values will always (sometimes
immediately, sometimes with a delay) react to volume spikes, and the
greater the magnitude of a spike (or series of spikes), the
stronger the ensuing reaction. (The many complex reasons why
sudden volume surge take place are beyond the scope of this
article).
Example 1: Remember
last year, when the long market downtrend finally reversed and
switched to a steady up-trend?
| Fig. 1 |
 |
Again, a volume analysis chart provides us with
fresh insight. Three volume spikes (two large ones in July and
October 2002, as well as a smaller VMA peak in February 2003)
correspond with a distinct long-term trend change for the S&P 500.
You could argue it was prompted by the outbreak of the war in Iraq.
However, our volume analysis indisputably demonstrates that that
index “was ready” to move up, given the large buildup of supportive
volume, as evidenced by the two very significant volume spikes. It
could also be argued that the new uptrend actually began on October
10, 2002 and that the January 2003 move to retest the recent lows
was just a mid-term correction of the new up-trend.
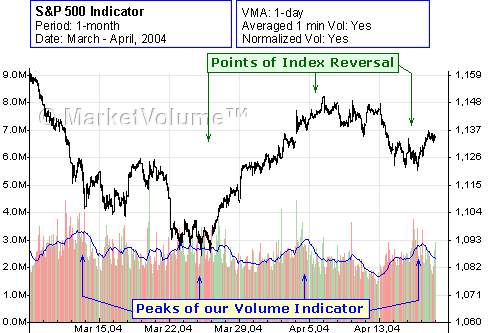
Example 2: Do you
remember the market action in March 2004?
| Fig. 2 |
 |
On this 30-day chart, you can clearly establish
that each major volume spike was followed by an index reversal.
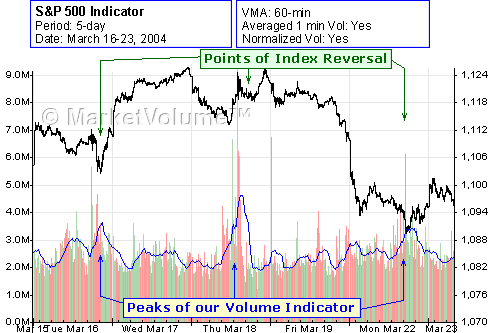
Example 3:
Fig. 3 shows that the discussed relationship between volume spikes
and index reversals applies equally well to the short-term, not just
to the mid- and long-term. Note how each volume spike coincides with
an index reversal point.
| Fig. 3 |
 |
Conclusions
Trading remains an inexact science, or perhaps
more fittingly, an art. Every trader knows that no system or
analysis technology is 100% perfect, and neither is volume
analytics. We have just touched on the topic briefly here, yet the
examples provided should have given you at least an idea of the
benefits this proven and refined methodology could bring to your
trading. If you would like to add volume-based approaches to your
trading arsenal, please visit
MarketVolume for further information. There is much to discover.
Open an account Today!
|
 |
|
QQQQ
Signals
Past 6 Months |
|
4%
 |
7%
 |
|
Compound |
Compound
Margin |
|
|
|
As of 01/07/2011 |
|
If you had started with $10,000 ago and made
percent, you would now have
$10,000 |
|


